This resource is a concise version of the Putting the “Info” in Infographics Workshop provided by TATP. Visit TATP’s Event Calendar for the future offerings of this workshop.
What is an infographic?
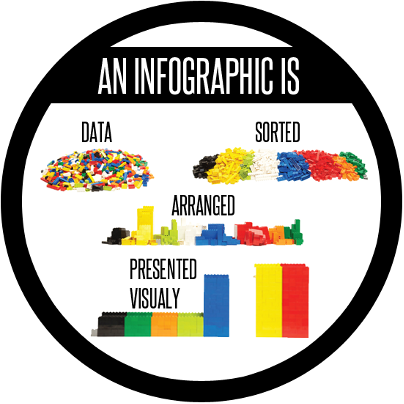
- Communicates and organizes complex information in a visual form
- Translates data into more accessible forms
- Improves understanding, decision making, and memory of complex topics
- Uses principles from fields such as communication design, psychology, analytics and statistics
When can infographics be used as a teaching tool?
Infographics can be used to teach key aspects about a topic at any point in the learning process. Infographics:
- Help you break down and organize complex information using visuals to show key concepts to students
- Give students the opportunity to showcase their understanding of and ability to summarize central course topics
- As a learning outcome: analyze qualitative and/or quantitative data
- As an assessment tool: demonstrate research data synthesis and communication
When considering infographics as a teaching tool, the first question you should ask yourself is: What are my objectives and priorities when creating/using an infographic?
Infographics Design Best Practices
Infographics design aims to embody the principles of universal design. Universal design refers to the “design of products and environments to be usable by all people, to the greatest extent possible, without the need for adaptation or specialized design” (Center for Universal Design, 2008).
Infographics created with this design allows multiple means of viewer engagement (e.g. images), representation (e.g. diverse representations of topics/theories), action and expression. While design best practices vary across fields, there are some general aspects of infographics design that should be addressed.
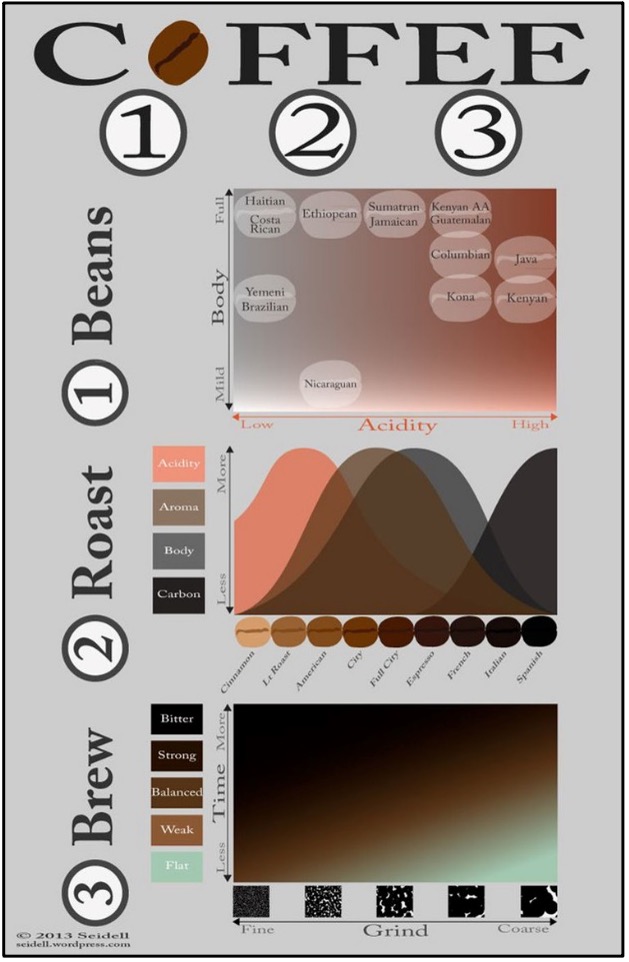
Review the coffee infographic on the right and consider what elements make the infographic effective or ineffective. Use the design checklist on page 2 as a guide.
Design Checklist
Answer yes or no to the following:
Content and Storytelling (remember your goal and audience): Is there a descriptive title?
Layout and Flow: Are the flow and pattern of reading intuitive?
Data and Charts (consider size, scale and type of chart): Are the data relevant to the goal?
Graphics and Icons: Do graphics and icons enhance content?
Fonts and Colours (consider readability, different fonts for different sections): Is there a typographic hierarchy? Do the colours enhance readability?
Infographics Rubric Sample
Content: Synthesis and Argument
- Proficient (15): Synthesizes content in a manner that supports the purposes and format of the infographic. Presents arguments and alternatives where appropriate.
- Emerging (10): Applies content in a manner that partially supports the purposes and format of the infographic. Little consideration of arguments and alternatives.
- Beginning (5): Does not apply content in a manner that supports the purposes and format of the infographic. No arguments and consideration of alternatives.
Design: Maker Tool
- Proficient (15): Communicates information via appropriate maker tool with clarity and depth.
- Emerging (10): Communicates information via maker tool in a competent manner.
- Beginning (5): Communicates information via maker tool in a fragmented manner.
Infographics Creation Tools Shortlist
Additional Resources
Infographics and Data Visualization
Beegel, J. (2014). Infographics for Dummies. Hoboken: John Wiley & Sons, Inc.
University of Toronto Libraries (n.d.). Infographic and Vector Graphic Tools.
Accessibility and Universal Design
Council of Ontario Universities (2017). Accessibility Resources Website. Retrieved from https://accessiblecampus.ca
Tobin, T.J., & Behling, K.T. (2018). Reach Everyone, Teach Everyone: Universal Design for Learning in Higher Education. Morgantown: West Virginia University Press.